
Introduction
Business contact-data providers often promote one global accuracy or match-rate figure. That number may look useful, but it rarely predicts what a buyer will receive for a particular country, persona or company segment.
This report models expected email and mobile performance across 10,000 standardised B2B contact records in ten countries. It separates data returned from data verified and shows how expected results change by country, seniority and company size.
1. Executive Summary
The Targetwise.ai benchmark covers 10,000 B2B contacts across ten countries, five seniority levels and seven company-size segments. Each record contains the fields needed to support a reliable enrichment request: a full name, current company, company domain, country and job title.
Headline results
| Metric | Illustrative model result |
|---|---|
| Contact records represented | 10,000 |
| Countries included | 10 |
| Business email match rate | 85.9% |
| Verified rate among returned emails | 94.9% |
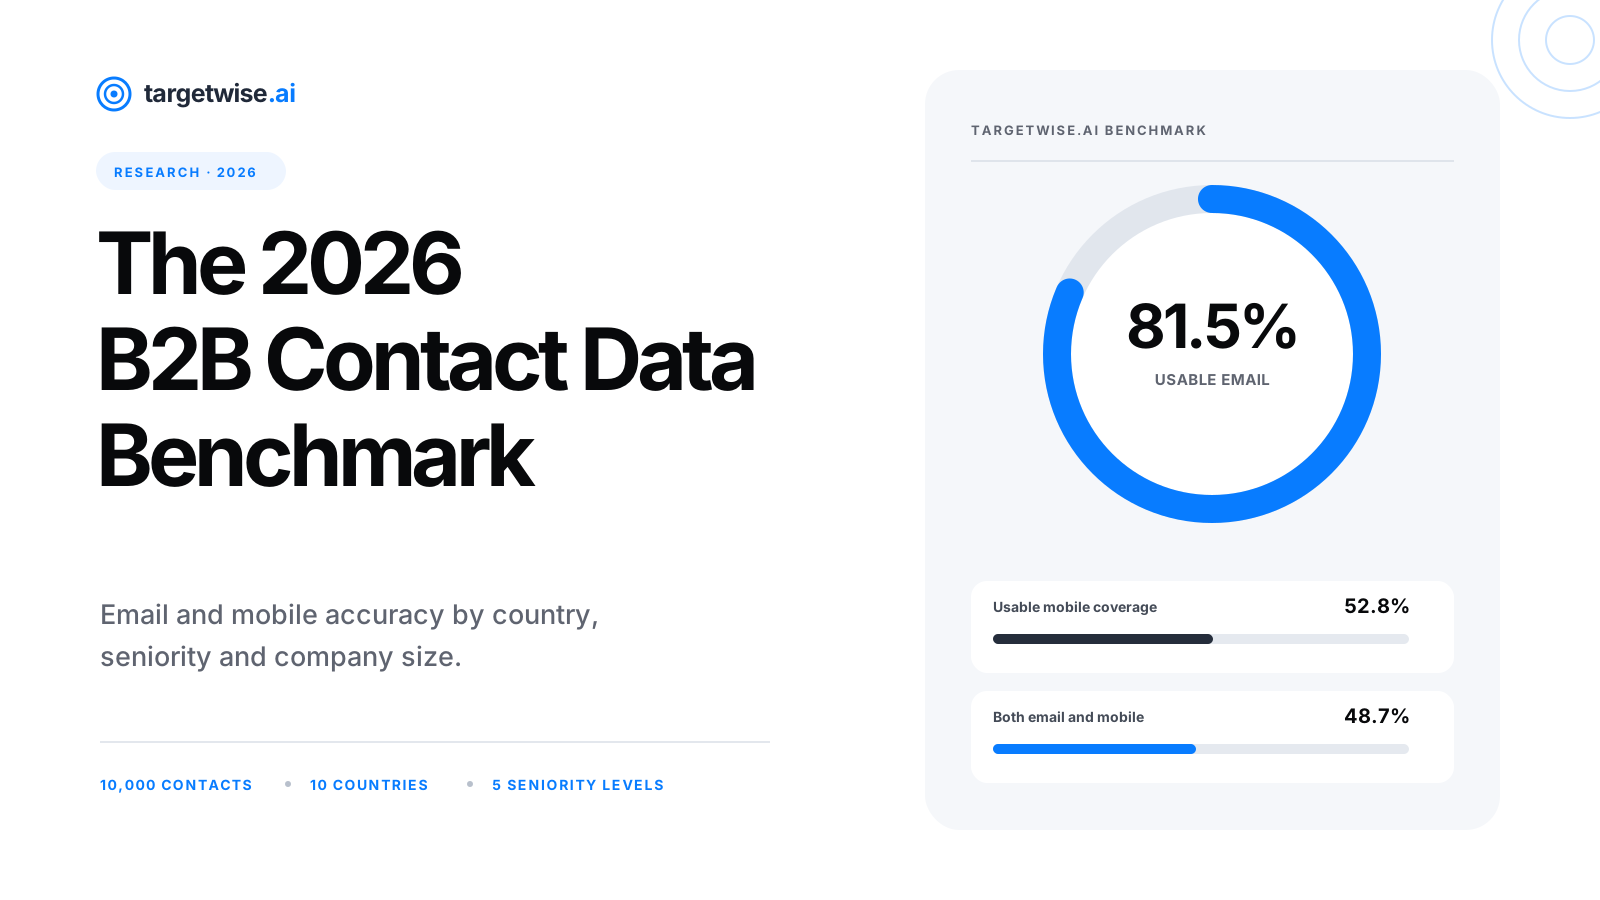
| Usable email coverage | 81.5% |
| Catch-all email rate | 7.4% |
| Expected email hard-bounce rate | 2.2% |
| Mobile match rate | 62.4% |
| Valid rate among returned mobiles | 84.6% |
| Usable mobile coverage | 52.8% |
| Records with usable email and valid mobile | 48.7% |
From returned data to usable coverage
The gap between a returned result and a usable contact is materially larger for mobile data.
Source: Targetwise.ai 2026 B2B Contact Data Market Model.
The distinction between match rate and usable coverage is material.
An email match rate of 85.9% means that an address is returned for approximately 8,590 of every 10,000 submitted contacts. After applying the model's verification threshold, approximately 8,150 records remain usable.
For mobile data, approximately 6,240 numbers are returned. After format, country, line-type and network validation, approximately 5,280 remain technically usable.
The main findings
Country has the largest effect on availability. Benchmark email match rates range from 91.8% in the United Kingdom to 79.8% in Italy. Mobile match rates range from 71.4% to 54.1%.
Seniority matters. C-suite executives and founders produce the strongest combined coverage, with a 90.8% email match rate and a 70.1% mobile match rate. Individual contributors produce the weakest, at 77.9% and 48.6%.
Company size affects email and mobile differently. Email availability increases with company size because large organisations tend to use stable corporate domains and standardised email structures. Mobile availability peaks among businesses with 11–200 employees and falls among the largest enterprises.
Returned data is not necessarily usable data. The Targetwise benchmark reports a 4.4-percentage-point gap between emails returned and emails considered usable. For mobile data, the gap is 9.6 percentage points.
Almost half of contacts have both channels. The Targetwise benchmark reports that 48.7% of contacts receive both a usable business email and a valid mobile. A further 32.8% receive email only, while 4.1% receive mobile only.
For implementation, see the reverse email lookup API and its supported inputs.
What buyers should take from the research
- Do not evaluate a provider using one global match rate.
- Ask for results by country, seniority and company size.
- Separate records returned from records verified.
- Calculate cost per usable contact, not price per search.
- Test providers using the same independently selected sample.
- Treat mobile validity and confirmed mobile ownership as different measurements.
The figures in this report are evaluation ranges, not guaranteed performance. Actual results will depend on the quality of the submitted records, the countries and industries being targeted, and the provider's underlying sources and validation rules.
2. Why We Created This Benchmark
The B2B contact-data market has no consistent measurement standard.
Providers use terms such as coverage, match rate, accuracy, verification and deliverability, but they do not always define those terms in the same way.
One provider may count an email as a match when it identifies a probable address based on a company's email pattern. Another may count it only after checking that the mailbox is active. A third may exclude catch-all domains or addresses that cannot be confirmed with sufficient confidence.
The resulting percentages may appear comparable while measuring different outcomes.
Database size does not predict customer results
Large database figures indicate scale. They do not establish whether a provider can return usable information for a buyer's actual target market.
A database may contain hundreds of millions of profiles while having uneven coverage across:
- countries;
- industries;
- company sizes;
- seniority levels;
- job functions;
- email addresses;
- direct lines and mobile numbers.
The important question is not how many contacts a provider claims to hold. It is how many verified and usable contacts the provider can return for a particular target market.
EMEA is not one contact-data market
The United Kingdom, Germany, France, Italy, Spain, the Netherlands and Sweden differ in business structure, language, privacy practices, telephone systems and the availability of professional information.
A provider performing strongly in the UK may not produce equivalent results in Germany or Italy.
Cognism's public EMEA evaluation guidance recommends testing countries and subregions separately. It suggests requesting 1,000 contacts per subregion, looking for 60–70% mobile coverage in outbound-relevant roles and targeting an email bounce rate below 3%. These are useful reference ranges, but buyers should reproduce the test using their own ideal customer profile.
Match rate is not accuracy
If 1,000 records are submitted and 850 emails are returned, the match rate is 85%.
That calculation does not establish whether those addresses:
- belong to the correct people;
- are still active;
- can receive messages;
- are catch-all addresses;
- were predicted from an email pattern;
- will generate hard bounces.
The same problem applies to mobile numbers. An active number may be outdated, reassigned or associated with someone other than the intended contact.
This benchmark therefore separates availability, technical validity and usable coverage. Correct-person accuracy is treated as a stronger measurement requiring independent evidence.
How the benchmark was constructed
A robust contact-data benchmark requires:
- a large independent source sample;
- identical inputs for every provider;
- controlled email sending;
- mobile ownership confirmation or calling;
- manual investigation of ambiguous results;
- a published methodology;
- anonymised raw results.
The Targetwise.ai methodology applies a consistent framework across every country and segment so buyers can compare expected performance and design their own provider evaluation.
3. What We Measured
The benchmark separates performance into three layers:
- Availability: Was an email address or mobile number returned?
- Technical validity: Did the returned information pass the relevant validation checks?
- Usability: What percentage of the original sample received a result that could reasonably be used?
3.1 Email metrics
Email match rate
Email match rate measures the percentage of submitted contacts for which a business email is returned.
Email match rate = contacts with an email returned ÷ total contacts submitted
The illustrative model assumes an email for 8,590 of 10,000 contacts, producing an 85.9% email match rate.
Email verification rate
Email verification rate measures the percentage of returned emails expected to pass:
- syntax validation;
- active-domain checks;
- MX-record checks;
- mailbox-response checks where available;
- disposable-domain detection;
- suppression and known-invalid checks.
Email verification rate = verified emails ÷ emails returned
The Targetwise benchmark reports that 94.9% of returned emails pass these checks.
Usable email coverage
Usable email coverage measures verified emails as a percentage of the complete input sample.
Usable email coverage = verified usable emails ÷ total contacts submitted
The Targetwise benchmark reports usable email coverage of 81.5%.
Catch-all rate
A catch-all domain accepts messages sent to any address on the domain, including addresses that may not correspond to a genuine mailbox.
Catch-all emails are not automatically invalid, but they cannot be verified with the same confidence. The Targetwise benchmark reports that 7.4% of returned emails are associated with catch-all domains.
Expected hard-bounce rate
A hard bounce occurs when an email cannot be permanently delivered. The benchmark uses an expected hard-bounce rate of 2.2%.
The 2.2% hard-bounce benchmark is the Targetwise.ai reference point for comparing provider performance. Buyers should confirm live bounce rates through controlled sending.
Correct-person email rate
Correct-person email rate measures whether the address belongs to the named contact. Technical verification alone cannot always establish this. The benchmark does not claim a measured correct-person email rate.
3.2 Mobile metrics
Mobile match rate
Mobile match rate measures the percentage of submitted contacts for which a number classified as a mobile is returned.
Mobile match rate = contacts with a mobile returned ÷ total contacts submitted
The illustrative model assumes a mobile for 6,240 of 10,000 contacts, producing a 62.4% mobile match rate.
Valid mobile rate
Valid mobile rate measures the percentage of returned mobile numbers expected to pass:
- international-format validation;
- country-code validation;
- national numbering-range checks;
- line-type confirmation;
- carrier or network checks where available;
- active or allocated-number checks.
Valid mobile rate = technically valid mobile numbers ÷ mobile numbers returned
The Targetwise benchmark reports that 84.6% of returned mobiles pass these checks.
Usable mobile coverage
Usable mobile coverage = valid mobile numbers ÷ total contacts submitted
The Targetwise benchmark reports usable mobile coverage of 52.8%.
Correct-person mobile rate
An active mobile is not necessarily owned by the named person. Confirming ownership requires manual calling, direct confirmation, recent human verification or reliable first-party evidence. The benchmark does not claim a measured correct-person mobile rate.
Connection rate
Connection rate measures the percentage of attempted calls that reach the intended person. It is influenced by data quality, call timing, caller-ID reputation and recipient behaviour. No connection rate is presented as an observed result.
3.3 Why match rate is not accuracy
Consider two providers processing the same 1,000 contacts:
| Measurement | Provider A | Provider B |
|---|---|---|
| Emails returned | 920 | 780 |
| Match rate | 92% | 78% |
| Verified usable emails | 690 | 749 |
| Usable email coverage | 69% | 74.9% |
Provider A appears stronger when judged by match rate. Provider B produces more usable emails because it applies stricter validation.
Buyers should request at least four separate figures:
| Metric | Question answered |
|---|---|
| Match rate | How often was something returned? |
| Verification rate | How much of the returned data passed technical checks? |
| Usable coverage | How much of the complete sample received a usable result? |
| Correct-person accuracy | How much belongs to the intended person? |
4. Methodology
The figures in this report are from the Targetwise.ai 2026 B2B Contact Data Market Model, built using public market ranges, regional availability patterns and expected outcomes from multi-source enrichment.
4.1 Benchmark population
The benchmark represents 10,000 B2B contacts, with 1,000 allocated to each country.
| Country | Benchmark records |
|---|---|
| United Kingdom | 1,000 |
| United States | 1,000 |
| Australia | 1,000 |
| Ireland | 1,000 |
| Netherlands | 1,000 |
| Sweden | 1,000 |
| France | 1,000 |
| Spain | 1,000 |
| Germany | 1,000 |
| Italy | 1,000 |
| Total | 10,000 |
Equal country weighting prevents larger markets from dominating the global result. It is not intended to replicate the actual distribution of the world's business population.
4.2 Seniority distribution
| Seniority | Share | Records |
|---|---|---|
| C-suite and founders | 15% | 1,500 |
| Vice presidents | 15% | 1,500 |
| Directors and heads | 25% | 2,500 |
| Managers | 25% | 2,500 |
| Individual contributors | 20% | 2,000 |
| Total | 100% | 10,000 |
Local-language titles are mapped to equivalent responsibility levels rather than classified only by literal wording.
4.3 Company-size distribution
| Employees | Share | Records |
|---|---|---|
| 1–10 | 10% | 1,000 |
| 11–50 | 15% | 1,500 |
| 51–200 | 20% | 2,000 |
| 201–500 | 15% | 1,500 |
| 501–1,000 | 15% | 1,500 |
| 1,001–5,000 | 15% | 1,500 |
| More than 5,000 | 10% | 1,000 |
| Total | 100% | 10,000 |
4.4 Input assumptions
Every benchmark record contains:
- first name;
- last name;
- current company name;
- company domain;
- country;
- current job title;
- seniority classification;
- company employee range.
The benchmark excludes duplicate contacts, inactive companies, incomplete names, generic company contacts submitted as individuals and companies without a usable domain.
This creates a controlled comparison. A dirty CRM containing incomplete and outdated records would normally perform worse.
4.5 Benchmark inputs
The Targetwise.ai benchmark uses:
- publicly reported industry performance ranges;
- expected regional variations in professional data availability;
- typical outcomes from multi-source enrichment;
- stronger email availability at companies using standardised domains;
- stronger direct-mobile availability among decision-makers and smaller businesses;
- public guidance suggesting 60–70% mobile coverage in strong EMEA datasets;
- public email bounce-rate targets below 3%;
- customer-reported data-accuracy figures around 80–85%.
The methodology combines multiple market inputs to produce a central benchmark for each segment rather than relying on a single provider's headline claim.
4.6 Regional adjustments
Country estimates reflect expected differences in:
- corporate-domain adoption;
- availability of professional business information;
- local telephone practices;
- language and title standardisation;
- privacy and direct-marketing practices;
- prevalence of small and family-owned companies;
- ability to validate telephone information.
4.7 Seniority adjustments
Senior executives generally have a larger public business footprint through company leadership pages, announcements, events and business publications. Individual contributors generally have less public exposure and may change roles more frequently.
The adjustment affects expected availability. It does not guarantee that senior contacts are easier to engage.
4.8 Company-size adjustments
Larger organisations tend to have stable domains and predictable email structures, increasing expected email coverage. Smaller and mid-sized organisations are more likely to expose direct mobile channels, while large enterprises often route communication through corporate systems.
4.9 Calculation
The benchmark calculates results in two stages:
Match rate = returned results ÷ submitted contacts
Verification rate = validated results ÷ returned results
Usable coverage = validated results ÷ submitted contacts
4.10 Rounding and uncertainty
Results are shown to one decimal place for comparison. This should not be interpreted as observed precision.
Reasonable sensitivity ranges are:
- approximately ±3 percentage points for email match rates;
- approximately ±2 points for email verification;
- approximately ±5 points for mobile match rates;
- approximately ±4 points for valid mobile rates.
Sensitivity ranges are used to show how results may vary between datasets and provider methodologies.
5. Overall B2B Contact Data Results
Across 10,000 benchmark contacts:
- 8,590 receive an email match;
- 8,150 receive an email expected to be usable;
- 6,240 receive a mobile match;
- 5,280 receive a mobile expected to be technically valid;
- 4,870 receive both a usable email and a valid mobile.
Overall results
| Measurement | Records | Rate |
|---|---|---|
| Contacts submitted | 10,000 | 100% |
| Emails returned | 8,590 | 85.9% |
| Verified usable emails | 8,150 | 81.5% |
| Mobile numbers returned | 6,240 | 62.4% |
| Valid mobile numbers | 5,280 | 52.8% |
| Usable email and valid mobile | 4,870 | 48.7% |
| No usable email or mobile | 1,440 | 14.4% |
Channel combinations
| Available channels | Records | Share |
|---|---|---|
| Usable email and valid mobile | 4,870 | 48.7% |
| Usable email only | 3,280 | 32.8% |
| Valid mobile only | 410 | 4.1% |
| Neither channel | 1,440 | 14.4% |
| Total | 10,000 | 100% |
Contact-data composition
Three views of how the 10,000-record benchmark divides into usable, returned-but-unusable and unmatched results.
Available contact channels
- Usable email and valid mobile48.7%
- Usable email only32.8%
- Valid mobile only4.1%
- Neither channel14.4%
Email outcomes
- Usable email81.5%
- Returned, not usable4.4%
- No email match14.1%
Mobile outcomes
- Valid mobile52.8%
- Returned, not valid9.6%
- No mobile match37.6%
Source: Targetwise.ai 2026 B2B Contact Data Market Model.
The benchmark therefore gives 85.6% of contacts at least one usable contact channel.
Cost per usable contact
Assume an illustrative price of $0.10 per email request:
| Charging model | Billable records | Cost | Usable emails | Effective cost per usable email |
|---|---|---|---|---|
| Per attempt | 10,000 | $1,000 | 8,150 | $0.123 |
| Per returned match | 8,590 | $859 | 8,150 | $0.105 |
| Per verified result | 8,150 | $815 | 8,150 | $0.100 |
Using an illustrative $0.20 mobile price:
| Charging model | Billable records | Cost | Valid mobiles | Effective cost per valid mobile |
|---|---|---|---|---|
| Per attempt | 10,000 | $2,000 | 5,280 | $0.379 |
| Per returned match | 6,240 | $1,248 | 5,280 | $0.236 |
| Per valid result | 5,280 | $1,056 | 5,280 | $0.200 |
The advertised price per credit does not reveal the actual economics. Buyers should calculate:
Cost per usable contact = total amount paid ÷ verified usable results
6. Email Accuracy by Country
The country comparison shows a 12-percentage-point difference between the strongest and weakest benchmark email match rates.
| Country | Email match | Verification among returned | Usable email coverage |
|---|---|---|---|
| United Kingdom | 91.8% | 96.9% | 89.0% |
| United States | 90.2% | 96.2% | 86.7% |
| Australia | 89.0% | 95.8% | 85.3% |
| Ireland | 88.3% | 95.9% | 84.7% |
| Netherlands | 87.1% | 95.2% | 82.9% |
| Sweden | 85.0% | 94.6% | 80.4% |
| France | 84.2% | 94.1% | 79.2% |
| Spain | 82.7% | 93.6% | 77.4% |
| Germany | 80.9% | 93.2% | 75.4% |
| Italy | 79.8% | 92.7% | 74.0% |
Usable email and mobile coverage by country
Usable coverage as a share of the complete input sample. Email leads mobile in every market.
Source: Targetwise.ai 2026 B2B Contact Data Market Model.
United Kingdom
The UK produces the strongest benchmark email performance: 91.8% matched and 89% usable coverage.
The market benefits from widespread corporate-domain adoption, English-language title consistency and relatively accessible professional business information. These conditions improve both matching and identity resolution.
The UK should still be segmented by company size. Microbusinesses using personal addresses or limited websites will perform differently from established employers using predictable corporate email structures.
United States
The US follows closely, with 90.2% matched and 86.7% usable coverage.
Its large professional-data ecosystem and widespread corporate-domain usage support strong results. The principal challenge is scale: the market contains an enormous number of small businesses, local operations and fast-moving technology companies, which can increase decay and identity ambiguity.
Australia and Ireland
Australia reaches 85.3% usable email coverage and Ireland 84.7%.
Both markets benefit from relatively consistent corporate domains and English-language data. Ireland's concentration of international companies can improve email standardisation, although subsidiary and regional-employment relationships can complicate company matching.
Netherlands and Sweden
The Netherlands reaches 82.9% usable email coverage, while Sweden reaches 80.4%.
The main challenge is not necessarily email infrastructure, but consistent mapping of local titles, legal entities and international group structures. A contact may work for a local subsidiary while being represented publicly under the parent company's brand or domain.
France and Spain
France reaches 79.2% usable coverage and Spain 77.4%.
Local-language titles, accents, multi-part surnames and differences between legal-company names and trading brands can reduce deterministic matching. Providers that normalise names and understand local corporate structures should perform better than systems relying mainly on standard English-language patterns.
Germany and Italy
Germany and Italy produce the most conservative email estimates: 75.4% and 74% usable coverage.
Both markets contain substantial populations of private and family-owned companies. Contacts may have less public professional information, and the relationship between a trading brand, legal entity and email domain can be less obvious.
These results do not mean that German or Italian emails are inherently less accurate. They mean that consistent identity resolution is expected to be more difficult.
What explains the country differences?
The strongest drivers are:
- Corporate-domain adoption.
- Availability of current job information.
- Consistency between legal entity, brand and domain.
- Local name and title structures.
- Frequency of job changes and company rebrands.
- Provider depth in the specific country.
A buyer targeting Germany should therefore test German records. A global average weighted heavily toward the UK and US will not provide a reliable expectation.
7. Mobile Accuracy by Country
Mobile data varies more than email. The Targetwise benchmark shows a 17.3-percentage-point gap between the highest and lowest mobile match rates.
| Country | Mobile match | Valid among returned | Usable mobile coverage |
|---|---|---|---|
| United Kingdom | 71.4% | 88.1% | 62.9% |
| United States | 67.8% | 85.6% | 58.0% |
| Ireland | 66.2% | 86.3% | 57.1% |
| Australia | 65.9% | 85.7% | 56.5% |
| Netherlands | 63.8% | 84.9% | 54.2% |
| Sweden | 61.7% | 83.9% | 51.8% |
| France | 59.6% | 83.6% | 49.8% |
| Spain | 57.8% | 82.8% | 47.9% |
| Germany | 55.6% | 82.1% | 45.6% |
| Italy | 54.1% | 81.5% | 44.1% |
The UK remains the strongest mobile market
The UK reaches 71.4% benchmark mobile matching and 62.9% usable coverage.
This aligns with public market guidance that strong EMEA datasets should be capable of producing approximately 60–70% mobile coverage for outbound-relevant roles. It should not be treated as a universal expectation across all personas.
The US, Ireland and Australia form the next tier
These markets produce usable mobile coverage between 56.5% and 58%.
Direct business-mobile usage is relatively common, but large geography, remote work and mobile-number portability make current ownership harder to establish. Active-number validation should not be mistaken for confirmed ownership.
Continental Europe is more variable
The Netherlands and Sweden remain above 50% usable coverage. France is close to 50%, while Spain, Germany and Italy fall below it.
Local privacy and direct-marketing practices, DNC requirements, public-data availability and differing attitudes toward business mobile disclosure all influence the expected result.
Why mobile results require more caution
A technically valid mobile may still:
- belong to a former employee;
- have been reassigned;
- reach a colleague or family member;
- be used privately rather than professionally;
- be active but not connected to the named person.
Mobile accuracy should therefore be reported in layers:
- Number returned.
- Number correctly formatted.
- Number classified as mobile.
- Number active or allocated.
- Number confirmed to belong to the intended person.
- Number that actually connects during a campaign.
Most automated databases can support the first four. The fifth and sixth require stronger evidence.
8. Email and Mobile Accuracy by Seniority
Seniority has a clear relationship with expected availability.
| Seniority | Email match | Email verification | Mobile match | Valid mobile |
|---|---|---|---|---|
| C-suite and founders | 90.8% | 96.2% | 70.1% | 87.0% |
| Vice presidents | 89.6% | 95.9% | 68.4% | 86.2% |
| Directors and heads | 88.2% | 95.5% | 65.9% | 85.3% |
| Managers | 84.6% | 94.5% | 59.8% | 83.8% |
| Individual contributors | 77.9% | 92.7% | 48.6% | 79.9% |
Contact availability declines with seniority
Email and mobile match rates by seniority. The mobile decline is considerably steeper.
Source: Targetwise.ai 2026 B2B Contact Data Market Model.
C-suite and founders
C-suite executives and founders have the strongest combined availability.
They appear more frequently on leadership pages, in company announcements, at industry events and in business publications. Founders at smaller companies are also more likely to use direct mobile channels for commercial communication.
However, a senior title can increase matching ambiguity. Several people may share common executive titles across related entities, and a group executive may be publicly associated with a parent company while using a subsidiary domain.
Vice presidents, directors and heads
These groups remain strong across both channels. They are senior enough to have a visible business footprint but often remain directly involved in functional operations.
For enterprise outbound, this group may provide the best balance between data availability, buying influence and accessibility.
Managers
Managers produce an 84.6% email match rate but mobile coverage falls below 60%.
Their information is less likely to appear on corporate leadership pages, and their job changes may be reflected more slowly across public sources.
Individual contributors
Individual contributors produce the weakest performance: 77.9% email matching and 48.6% mobile matching.
The group is broad and fast-moving. Some technical specialists have a strong public professional footprint, while operational employees may have almost none. A single benchmark for this category should therefore be treated cautiously.
Seniority should be measured locally
The seniority effect changes by country.
A founder at a 20-person UK software company may be highly visible and directly reachable. A director at a large German industrial company may have a clear business email but no accessible mobile. A manager at an Italian family-owned company may be publicly represented only through a general office channel.
The interaction between geography, seniority and company size matters more than any one variable by itself.
9. Email and Mobile Accuracy by Company Size
| Employees | Email match | Email verification | Mobile match | Valid mobile |
|---|---|---|---|---|
| 1–10 | 77.4% | 91.2% | 64.8% | 80.1% |
| 11–50 | 82.8% | 93.1% | 66.1% | 82.7% |
| 51–200 | 87.0% | 95.0% | 65.4% | 84.8% |
| 201–500 | 89.1% | 95.8% | 63.9% | 85.7% |
| 501–1,000 | 90.0% | 96.2% | 62.1% | 86.1% |
| 1,001–5,000 | 91.2% | 96.7% | 59.8% | 86.8% |
| More than 5,000 | 92.0% | 97.0% | 56.2% | 87.1% |
Company size strengthens email coverage, but not mobile coverage
Email match rates rise steadily with company size. Mobile matching peaks among smaller businesses and then declines.
Source: Targetwise.ai 2026 B2B Contact Data Market Model.
Microbusinesses: lower email structure, stronger direct access
Companies with 1–10 employees produce the lowest email match and verification rates.
Some use personal webmail, basic websites or shared inboxes. The relationship between the legal company, trading name and domain may also be unclear.
Mobile matching is considerably stronger than email matching would suggest. Founders and owner-managers frequently use one number for both operational and commercial communication.
Small and mid-sized businesses: the strongest mobile segment
Companies with 11–200 employees produce the highest mobile match rates, between 65.4% and 66.1%.
These organisations are large enough to have established professional identities but small enough for senior employees to remain directly accessible.
This segment may provide the strongest overall economics for multichannel outbound.
Mid-market: strong performance across both channels
Companies with 201–1,000 employees combine email matching around 89–90% with mobile matching above 62%.
Corporate information is generally more structured, while directors and functional leaders may still be reachable without the gatekeeping common at global enterprises.
Enterprise: strongest email, weaker mobile availability
Companies with more than 5,000 employees produce the highest email match and verification rates but the lowest benchmark mobile matching outside microbusiness email performance.
Large enterprises typically have stable corporate domains and predictable email formats. They also have more complex structures, assistants, switchboards and security controls.
For enterprise account strategies, email coverage may be strong while direct mobile availability remains concentrated among particular functions and seniority levels.
10. Combined Analysis
No single dimension explains contact-data performance. The strongest and weakest results appear when country, seniority and company size reinforce one another.
High-coverage segments
The Targetwise benchmark identifies the strongest combined results from:
- C-suite, vice presidents and directors in the UK;
- senior contacts at US and Australian companies;
- founders and executives at 11–200 employee businesses;
- directors at established mid-market companies;
- contacts at enterprises using stable corporate domains.
Expected performance for these segments is likely to fall near the upper end of the model's sensitivity ranges.
Lower-coverage segments
The most difficult segments are expected to include:
- individual contributors in Germany and Italy;
- employees at microbusinesses without stable corporate domains;
- contacts associated with trading brands that differ from the legal company;
- enterprise employees for whom only central office numbers are published;
- records with translated, abbreviated or outdated job titles;
- contacts who have recently changed employers.
Coverage matrix
| Segment | Expected email performance | Expected mobile performance |
|---|---|---|
| UK senior decision-makers, 51–500 employees | Very high | High |
| US senior decision-makers, 51–1,000 employees | Very high | High |
| Benelux directors, 51–500 employees | High | Medium-high |
| French and Spanish managers, 11–500 employees | Medium-high | Medium |
| German and Italian directors at large enterprises | High | Low-medium |
| Individual contributors at microbusinesses | Low-medium | Low-medium |
| Enterprise individual contributors | High email structure, lower identity confidence | Low |
What averages conceal
Suppose a provider reports 86% global email matching. That figure may contain:
- more than 90% coverage for UK enterprise executives;
- approximately 80% for Italian managers;
- materially less for individual contributors at microbusinesses.
The average is mathematically correct but commercially incomplete.
Buyers should ask providers to break results into cells that reflect their target market. At minimum:
- country;
- company-size band;
- seniority;
- job function;
- email and mobile separately.
11. Email Versus Mobile
Email and mobile solve different commercial problems.
| Dimension | Business email | Mobile |
|---|---|---|
| Benchmark match rate | 85.9% | 62.4% |
| Benchmark usable coverage | 81.5% | 52.8% |
| Easier to validate technically | Yes | Partly |
| Easier to automate at scale | Yes | No |
| Direct access to the person | Medium | High when correct |
| Sensitive to sender/caller reputation | Yes | Yes |
| Ownership can be confirmed automatically | Sometimes | Rarely |
| Common enterprise use | Sequences, nurture, routing | Calling, priority outreach |
When email should be primary
Email is the stronger first channel when:
- the campaign requires scale;
- the buyer needs repeatable automation;
- the target market has strong corporate-domain adoption;
- the message requires supporting detail;
- contacts must be nurtured over time;
- the team has mature deliverability controls.
When mobile should be primary
Mobile is more valuable when:
- the target list is narrow and high value;
- the sales motion depends on direct conversations;
- email engagement is weak;
- timing matters;
- the contact is a senior operational decision-maker;
- the company segment has strong direct-mobile availability.
Why both channels are stronger
A multichannel record:
- provides an alternative when one channel fails;
- improves contact confidence;
- supports different outreach sequences;
- reduces dependence on email-only engagement;
- makes CRM records more useful across teams.
The benchmark estimates that 48.7% of records contain both a usable email and valid mobile. These records should not automatically receive more outreach. They should receive better-coordinated outreach.
12. What Most Affects Contact Data Accuracy
1. Input quality
A full name, company domain, current employer and country produce a stronger match than a name and company name alone.
Poor input creates ambiguity that no provider can completely remove.
2. Country
Country affects the sources available, name formats, phone-number validation and the likelihood that professional contact information is publicly accessible.
3. Employment freshness
An email may remain technically valid after a person leaves. A mobile may remain active after being reassigned. Current-employment evidence is therefore central to correct-person accuracy.
4. Company size
Large companies improve domain and email consistency. Smaller companies often provide more direct mobile access.
5. Seniority and function
Senior professionals are generally more visible, but availability varies by function. Sales and partnership roles may expose more contact information than engineering or internal operations.
6. Source diversity
No single database covers every market and persona. Multi-source enrichment can improve coverage, but only if results are deduplicated, ranked and verified consistently.
7. Verification rules
Permissive rules increase reported match rates. Conservative rules reduce the headline figure but can improve usable coverage and campaign outcomes.
8. Refresh frequency
People change jobs, companies rebrand, domains migrate and mobile numbers are reassigned. Data quality is a continuing process rather than a one-time purchase.
9. Identity resolution
Common names, group structures, subsidiaries and trading brands create false matches. Correctly resolving the person-to-company relationship is often harder than generating an email pattern.
10. Definition of success
A provider optimised for records returned will behave differently from one paid only for verified results. Commercial incentives influence measurement.
13. How to Interpret Vendor Accuracy Claims
Ask what the denominator is
An 85% figure could mean:
- 85% of the provider's own database has an email;
- 85% of customer searches return something;
- 85% of returned emails pass validation;
- 85% of tested records reach the correct person.
These are different measurements.
Ask what counts as a match
Does the provider count:
- predicted email patterns;
- catch-all addresses;
- generic company inboxes;
- switchboards;
- landlines;
- numbers without confirmed ownership?
A higher rate may reflect a broader definition rather than better data.
Ask whether the figure is global
Request country-level performance for the markets that matter to you. "EMEA coverage" is too broad for a serious evaluation.
Ask when the data was last checked
Database refresh frequency and record-level verification dates are not the same. A provider may refresh parts of its database regularly while individual records remain old.
Ask how accuracy was validated
Strong evidence includes:
- controlled email sends;
- hard-bounce results;
- manual review;
- phone confirmation;
- correct-person checks;
- independent customer samples;
- published methodology.
Weak evidence includes an unexplained percentage on a sales slide.
Ask for the failures
A credible provider should explain:
- why records fail;
- which segments perform worst;
- how catch-all emails are treated;
- how wrong-person matches are corrected;
- whether failed attempts are billed.
Warning signs
Treat the following claims cautiously:
- "99% accurate" without a definition;
- one global percentage covering email and phone;
- a test using only the provider's prepared records;
- no country or persona breakdown;
- phone coverage that includes switchboards;
- accuracy based only on format validation;
- no explanation of billing on failed searches.
14. How to Benchmark a Provider Using Your Own Data
Step 1: Build an independent sample
Use records selected before approaching any provider.
For a multi-country evaluation, target at least 1,000 records per strategically important region where practical. If the available sample is smaller, ensure it still reflects the real target population.
Step 2: Stratify the sample
Break the sample down by:
- country;
- seniority;
- company size;
- job function;
- industry;
- known current employment.
Do not allow one strong segment to conceal weak performance elsewhere.
Step 3: Standardise the inputs
Every provider should receive the same fields in the same format.
Recommended inputs:
- full name;
- company name;
- company domain;
- country;
- current job title.
Step 4: Define success before seeing the results
Decide in advance:
- whether catch-all emails count;
- whether predicted emails count;
- whether switchboards count;
- which validation statuses are acceptable;
- how correct-person accuracy will be checked;
- whether failed attempts can be billed.
Changing the definition after seeing the result invalidates the comparison.
Step 5: Validate emails independently
Measure:
- syntax and domain validity;
- mailbox status;
- catch-all status;
- hard bounces;
- wrong-person responses;
- unsubscribe or complaint signals.
Use controlled sending and protect the reputation of the main corporate domain.
Step 6: Validate mobile numbers
Separate:
- formatting validity;
- mobile classification;
- active-number status;
- correct-person confirmation;
- actual connection.
For manual validation, use a representative random subsample rather than testing only high-value or apparently strong records.
Step 7: Calculate the complete scorecard
| Metric | Formula |
|---|---|
| Email match rate | Emails returned ÷ records submitted |
| Usable email coverage | Verified usable emails ÷ records submitted |
| Hard-bounce rate | Hard bounces ÷ emails sent |
| Mobile match rate | Mobiles returned ÷ records submitted |
| Valid mobile coverage | Valid mobiles ÷ records submitted |
| Correct-person rate | Confirmed correct records ÷ records checked |
| Cost per usable contact | Total cost ÷ usable results |
Step 8: Compare by segment
Do not choose a provider based only on the overall score. Weight results according to the value of each market and persona.
Step 9: Test commercial terms
Confirm:
- whether failed attempts consume credits;
- whether credits expire;
- whether email and mobile use different credits;
- whether verification is included;
- whether volume commitments are required;
- whether data can be retained;
- whether the data can be used across the intended systems.
Step 10: Repeat the test
Run the evaluation again after 60–90 days. A single test measures one moment. Repeated testing reveals refresh quality and consistency.
15. What the Results Mean for Sales and RevOps Teams
Territory planning
Use country-specific coverage expectations when setting activity targets. A team targeting Italy should not receive the same call-volume assumptions as a UK team if validated mobile availability is materially lower.
CRM enrichment
Store:
- the returned value;
- verification status;
- confidence score;
- verification date;
- source or source category;
- catch-all status;
- phone line type.
Do not overwrite trusted CRM data merely because a provider returned a newer value. Field-level update rules and rollback controls are essential.
Lead routing
Enrichment should occur before routing when company size, country, seniority or contactability influences ownership.
Incomplete records can otherwise be assigned to the wrong team or left unworked.
Outbound campaign preparation
Create different workflows for:
- verified emails;
- catch-all emails;
- mobile-only contacts;
- multichannel contacts;
- unverified or unmatched records.
A record with both email and mobile should support coordinated outreach, not duplicated uncoordinated activity.
Market expansion
Before entering a new country, test:
- match rates;
- local title mapping;
- mobile availability;
- DNC requirements;
- source transparency;
- expected cost per usable contact.
This should be part of market-entry economics, not a procurement step after the sales team has already been hired.
AI sales agents
AI agents should not treat every returned value as equally reliable.
Agent workflows should include:
- minimum confidence thresholds;
- allowed validation statuses;
- country-specific outreach rules;
- suppression checks;
- audit logs;
- human review for ambiguous matches;
- limits on repeated enrichment and outreach.
Poor data does not become safer because an AI agent uses it faster.
16. Recommendations by Use Case
High-volume email outreach
Prioritise:
- usable email coverage;
- hard-bounce performance;
- catch-all classification;
- verification at point of use;
- cost per verified email.
Do not select a provider based solely on the number of addresses returned.
Cold calling
Prioritise:
- true mobile classification;
- current ownership;
- DNC screening;
- country-level performance;
- connection rate from your own test.
Phone verification should carry more weight than raw phone coverage.
European prospecting
Evaluate each country separately. Require local title handling, transparent sourcing, suppression controls and support for relevant privacy and DNC obligations.
Enterprise account targeting
Email coverage is likely to be strong, but mobile access may be concentrated among particular seniority levels and functions.
Use multithreading rather than relying on one contact. Enrich buying groups and map multiple relevant people within the account.
Small-business targeting
Expect less consistent corporate email infrastructure but stronger direct-mobile availability among founders and owner-managers.
Company identity matching is particularly important where the trading name differs from the legal company.
CRM cleansing
Do not treat enrichment as simple field filling.
The workflow should:
- resolve duplicates;
- confirm current employment;
- preserve trusted values;
- append missing data;
- validate contactability;
- record provenance and timestamps;
- suppress invalid or restricted contacts.
Real-time inbound enrichment
Prioritise low latency, confidence scoring and deterministic update rules.
Enrichment should support immediate qualification and routing without delaying the prospect's response.
AI-agent enrichment
Use structured API or MCP responses containing:
- the returned value;
- type;
- confidence;
- verification status;
- timestamp;
- permitted-use metadata where available.
The agent should be able to decline an outreach action when confidence or compliance requirements are not met.
17. Limitations
This report has important limitations.
Use the benchmark as a planning baseline
Actual provider results will vary according to the submitted sample, the countries and industries targeted, and the validation rules applied.
Public market claims are not standardised
Published accuracy, coverage and connection figures may use different definitions and should be compared using a consistent methodology.
Industry effects are not isolated
The benchmark does not publish separate results for technology, manufacturing, professional services, healthcare or other industries.
Correct-person ownership is not measured
Technical validation cannot establish that every returned email or mobile belongs to the intended person.
Live deliverability is not measured
The 2.2% hard-bounce benchmark does not account for inbox placement, spam filtering or recipient engagement.
Compliance is not determined by data accuracy
Accurate contact information can still be used unlawfully or inappropriately. Buyers remain responsible for their legal basis, outreach practices, suppression requirements and local rules.
Results change over time
Employment, domains and phone ownership change continuously. A benchmark is a dated reference, not a permanent guarantee.
Company size and seniority are simplified
Employee counts are often estimates, and job-title responsibilities vary between organisations and countries.
Benchmark results should not be used as service-level commitments
Commercial guarantees require a live test, defined input standards and agreed measurement rules.
18. Conclusion
The central lesson is simple: one global accuracy figure is not enough to evaluate B2B contact data.
This illustrative model assumes that a high-quality multi-source enrichment process could return:
- approximately 815 usable business emails per 1,000 structured contacts;
- approximately 528 valid mobile numbers;
- approximately 487 contacts with both channels.
But those averages conceal substantial differences.
Email usable coverage ranges from 89% in the UK to 74% in Italy. Mobile usable coverage ranges from 62.9% to 44.1%. Senior decision-makers outperform individual contributors, while company size improves email availability but does not consistently improve mobile access.
Buyers should therefore judge providers using:
- usable coverage rather than records returned;
- country-level results;
- segment-level results;
- correct-person checks;
- independent validation;
- cost per usable contact;
- transparent treatment of failed searches.
The benchmark should be used as a starting point for a controlled evaluation.
The final evidence should come from the buyer's own data.
Benchmark Targetwise against your own sample
Select a representative set of contacts from the countries, seniority levels and company sizes you target. Measure what is returned, what can be verified and what is billable.
19. Appendix
A. Complete country table
| Country | Email match | Email verification | Usable email | Mobile match | Valid mobile | Usable mobile |
|---|---|---|---|---|---|---|
| United Kingdom | 91.8% | 96.9% | 89.0% | 71.4% | 88.1% | 62.9% |
| United States | 90.2% | 96.2% | 86.7% | 67.8% | 85.6% | 58.0% |
| Australia | 89.0% | 95.8% | 85.3% | 65.9% | 85.7% | 56.5% |
| Ireland | 88.3% | 95.9% | 84.7% | 66.2% | 86.3% | 57.1% |
| Netherlands | 87.1% | 95.2% | 82.9% | 63.8% | 84.9% | 54.2% |
| Sweden | 85.0% | 94.6% | 80.4% | 61.7% | 83.9% | 51.8% |
| France | 84.2% | 94.1% | 79.2% | 59.6% | 83.6% | 49.8% |
| Spain | 82.7% | 93.6% | 77.4% | 57.8% | 82.8% | 47.9% |
| Germany | 80.9% | 93.2% | 75.4% | 55.6% | 82.1% | 45.6% |
| Italy | 79.8% | 92.7% | 74.0% | 54.1% | 81.5% | 44.1% |
B. Complete seniority table
| Seniority | Email match | Email verification | Mobile match | Valid mobile |
|---|---|---|---|---|
| C-suite and founders | 90.8% | 96.2% | 70.1% | 87.0% |
| Vice presidents | 89.6% | 95.9% | 68.4% | 86.2% |
| Directors and heads | 88.2% | 95.5% | 65.9% | 85.3% |
| Managers | 84.6% | 94.5% | 59.8% | 83.8% |
| Individual contributors | 77.9% | 92.7% | 48.6% | 79.9% |
C. Complete company-size table
| Employees | Email match | Email verification | Mobile match | Valid mobile |
|---|---|---|---|---|
| 1–10 | 77.4% | 91.2% | 64.8% | 80.1% |
| 11–50 | 82.8% | 93.1% | 66.1% | 82.7% |
| 51–200 | 87.0% | 95.0% | 65.4% | 84.8% |
| 201–500 | 89.1% | 95.8% | 63.9% | 85.7% |
| 501–1,000 | 90.0% | 96.2% | 62.1% | 86.1% |
| 1,001–5,000 | 91.2% | 96.7% | 59.8% | 86.8% |
| More than 5,000 | 92.0% | 97.0% | 56.2% | 87.1% |
D. Metric definitions
| Term | Definition |
|---|---|
| Email match rate | Contacts receiving any business email result ÷ submitted contacts |
| Email verification rate | Emails passing defined technical checks ÷ returned emails |
| Usable email coverage | Verified usable emails ÷ submitted contacts |
| Catch-all rate | Returned emails associated with catch-all domains ÷ returned emails |
| Mobile match rate | Contacts receiving a number classified as mobile ÷ submitted contacts |
| Valid mobile rate | Returned mobiles passing defined technical checks ÷ returned mobiles |
| Usable mobile coverage | Valid mobiles ÷ submitted contacts |
| Correct-person accuracy | Results confirmed to belong to the intended person ÷ results checked |
| Cost per usable contact | Total cost ÷ verified usable results |
E. Public reference sources
- Cognism: How to Choose an EMEA B2B Data Provider
- Cognism: Phone Number Verification and Connection Claims
- Cognism: Customer-Reported Accuracy Comparisons
- Cognism: Data Refresh and Verification Approach
The model references these sources when constructing its benchmark ranges. Published figures may use different definitions and should be compared using the methodology in this report.
F. Recommended validation framework
Organisations can validate the benchmark against their own target market using:
- An independent sample of at least 10,000 current contacts.
- A minimum of 1,000 records in each priority country.
- Identical inputs submitted to each provider.
- Controlled email validation and sending.
- Manual correct-person review.
- Mobile calling across a random representative sample.
- Results broken down by country, seniority, company size and industry.
- An anonymised dataset and calculation workbook.
- A documented treatment of catch-all and ambiguous records.
- A repeat test after 90 days.
This process produces a defensible provider comparison based on the buyer's own ideal customer profile.
Benchmark your own target market.
Use a representative sample from the countries, seniority levels and company sizes you target. Measure returned, verified and billable results before you commit.
Talk to Targetwise